Vineyard and Orchard Remote Monitoring
Harvest Systems use solar powered loggers with built in cell phone modems to remotely monitor Internet of Things (IoT) sensors attached to the base station and optional wireless UHF radio remotes within a few kilometres of the base station. The live data and history can be viewed on the Harvest web site using any computer or smartphone.
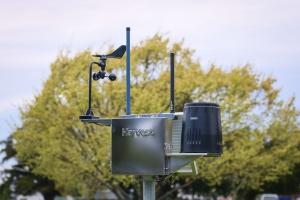
Harvest systems are typically set up to include a weather station with 15 minute updates to a Harvest web page. Once the temperature drops below your customisable frost threshold, text and voice call alarms are triggered and the logger starts sending data every minute. Parameters that are typically monitored include air temperature, relative humidity, rainfall, wind speed and direction, leaf wetness, and solar radiation (for evapotranspiration calculation).
Sensors can also be connected to wireless remotes to cover particularly frost prone parts of the property. If any of these sensors drop below your frost alarm thresholds then frost alarms and minute updates will be triggered. Frequent updates in frost conditions is particularly helpful for measuring frost fighting effectiveness.
Designed and manufactured in New Zealand by Harvest, these systems are the most popular across the country in vineyards and orchards. The first system was installed on Graeme McKenzie's Paengaroa kiwifruit orchard in 2003. All data collected is owned by the grower and is stored forever. At any time growers can download historical data to assist in future planning for things like irrigation, frost protection and disease modelling. No one offers better after sales support and service than Harvest.
Vineyard owners know the benefits of accurate moisture measurement and irrigation to enhance growth and the manipulate the fruit sugar levels.
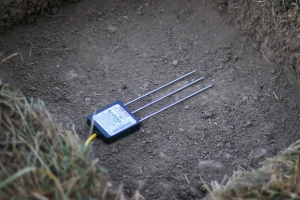
Old technology capacitive soil moisture probes are very susceptible to reading errors as the soil conductivity changes and as the soil is compacted over time. Whenever fertiliser is applied the conductivity changes. The new generation time time domain Reflectometry (TDR) probes are very stable and accurate even when in differing soil types, soil compaction and soil conductivity changes. They do not ever need field calibrating.
TDR probes are the only probes which can be pushed into the undisturbed soil in the side of a freshly dug hole and give instant accurate readings. Most other probes need to be covered in soil so it can take months before the probe gives accurate readings. For Kiwifruit we recommend two probes at different depths so you can see the shallow and deep moisture levels. The most common depths for Kiwifruit are 300mm and 600mm. When you irrigate, the shallow probe is the most important one to watch and use to make irrigation decisions.
There are several companies that make multilevel probes which claim to show the moisture at multiple levels. However all these probes are capacitive so they will suffer from the inaccuracies of all capacitive probes. They will show you a pretty picture of whether the soil is wet or dry at each depth but they will need calibrating and will not accurately show the actual soil moisture over any extended time period if any fertiliser is applied. It is much better to have two accurate probes than a lot of inaccurate measurements. The slightly higher initial cost of TDR probes is recovered the first time you would have calibrated capacitive probes.
Harvest are very pleased to be the New Zealand distributors of the world leading True TDR probes made by Acclima in the USA. Twenty years ago TDR probes were recognised as the gold standard in accuracy but they cost $10,000 each so were limited to research applications. Now the probes are very affordable and not much more expensive than capacitive probes.
The Acclima probes are covered by international patents so other probes claiming to be TDR are either not true TDR or they are likely infringing the Acclima patents. Harvest is also happy to supply these probes to customers who are using other brands of remote monitoring equipment.
You can read more about our soil moisture monitoring in our brochure and white paper, or contact us for more information.
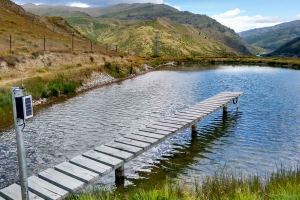
Harvest monitoring devices can provide real-time readings and configurable alarms for water and irrigation systems. Common applications include flow meter monitoring (optional transfer of data to council), water tank level, well/bore level, pipe pressure, and pump control. Alarms (txt message, email, or voice call) can be set up for any of the measured values e.g. max daily water usage exceeded, low tank or bore level etc. Remote control can be a secure virtual switch on the Harvest web page or the Harvest App or based on a measured value e.g. if block temperature drops below X°C, start the frost fighting pump.
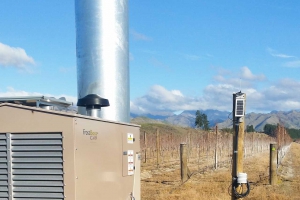
Wind machine (frost fan) monitoring can be retro-fitted to provide online diagnostics and automated alarms for startup or run failure. Parameters that are typically monitored are status (on/off), battery voltage, RPM of the shaft, and wind speed. Once your customisable frost alarm thresholds are met, the data updates every minute. For more information about our wind machine monitoring, please contact us or see our brochure.